The US Government Debt Debate

Reviewed by Michael Paige, Bailey Pemberton
"We have the golden goose. We have this reserve currency status because the dollar is the safest currency in the world and the US economy is the best. Why would you jeopardize that?" - Howard Marks
If you’ve got variable interest rate debts outstanding, you may have noticed your repayments increase over the last 2 years. The more debt outstanding, the bigger the change. Well… imagine if you had $33 trillion in debt outstanding? 😅
That’s why this week we’re doing a deep dive on the US Government Debt situation.
In light of the ongoing debt ceiling debate and rising rates, it’s crucial to know what options policymakers have, and more importantly, how these policies can impact countries, markets and stocks we want to invest in!
Let’s dive in!
🎧 Would you prefer to listen to these insights? You can find the audio version on our Spotify or Apple podcasts !
The US Government Shut Down
At the end of September the US lawmakers averted a government shutdown with a temporary spending bill. This gives Congress until mid November to agree on spending plans (meanwhile back in June this year, the debt ceiling was suspended until January 2025). In other words, the can has been kicked slightly further down the road, until another standoff and possible shutdown in November.
We’re starting to wonder how long this road is…
The Imaginary Debt Ceiling
The debt ceiling is an arbitrary limit, and every time it’s been reached in the past it's ultimately been raised. In fact it’s been raised 78 times since 1960, making it a very ineffective ceiling. It is however a useful negotiating and grandstanding tool for politicians.
It can however result in a government shutdown which has some consequences. Some government employees don’t get paid (though they receive back pay later), and some programs are suspended. Thankfully though, unlike the debt ceiling issues which threatened a US Sovereign debt default, a shutdown would not affect government debt payments.
Should Investors Worry About A Shutdown?
This wouldn’t be the US’s first rodeo. There have been 21 government shutdowns since 1975 and the impact on markets has been temporary and minor. However, there are a few points to note:
- A drawn out negotiation, and a possible shutdown could lead to another ratings downgrade.
- Normally this would be a big deal, but in the case of US debt, investors have few appealing alternatives - so the impact of that would probably be negligible (have you heard of the dollar milkshake theory? ). Nevertheless another ratings downgrade would probably lead to a knee jerk sell-off for financial markets.
- Government shutdowns do act as a drag on GDP
- However the effect on annual GDP is minimal as it typically only amounts to a few weeks of the year.
- Negotiations could affect government spending in a specific sector, healthcare being an example.
- So this is something to pay attention to if it could affect a company you are invested in (how much of a stock’s revenue is reliant on government contracts or government spending?
- But this can work both ways, and volatility could create an opportunity to invest at a lower price.
The Bigger US Debt Debate
While the US goes from one debt ceiling standoff to the next, the underlying issue of its government debt is very real.
Total government debt is now a staggering $33.5 trillion. Technically it's closer to $27 trillion as some of that debt is held by the government itself - but either way, it’s a staggering number.
While the total amount of debt makes for sensational headlines, it's not actually a meaningful way to look at debt. To put it in context we need to look at the debt to GDP ratio, and compare the cost of paying the interest on that debt to tax revenues and the country’s overall budget.
The US debt to GDP ratio is now about 130%. That’s the highest it’s ever been and amongst the highest in the world - but the US is in a better position to manage that debt than most countries with similar ratios.
The chart below shows the interest payments on US government debt in 2022 dollars (beige columns) and as a percent of federal spending (blue line). This shows that interest payments as a percent of the budget aren’t very high by historical standards (currently 6.1%). The catch here is that the current level benefits from the super low interest rates of the last decade.
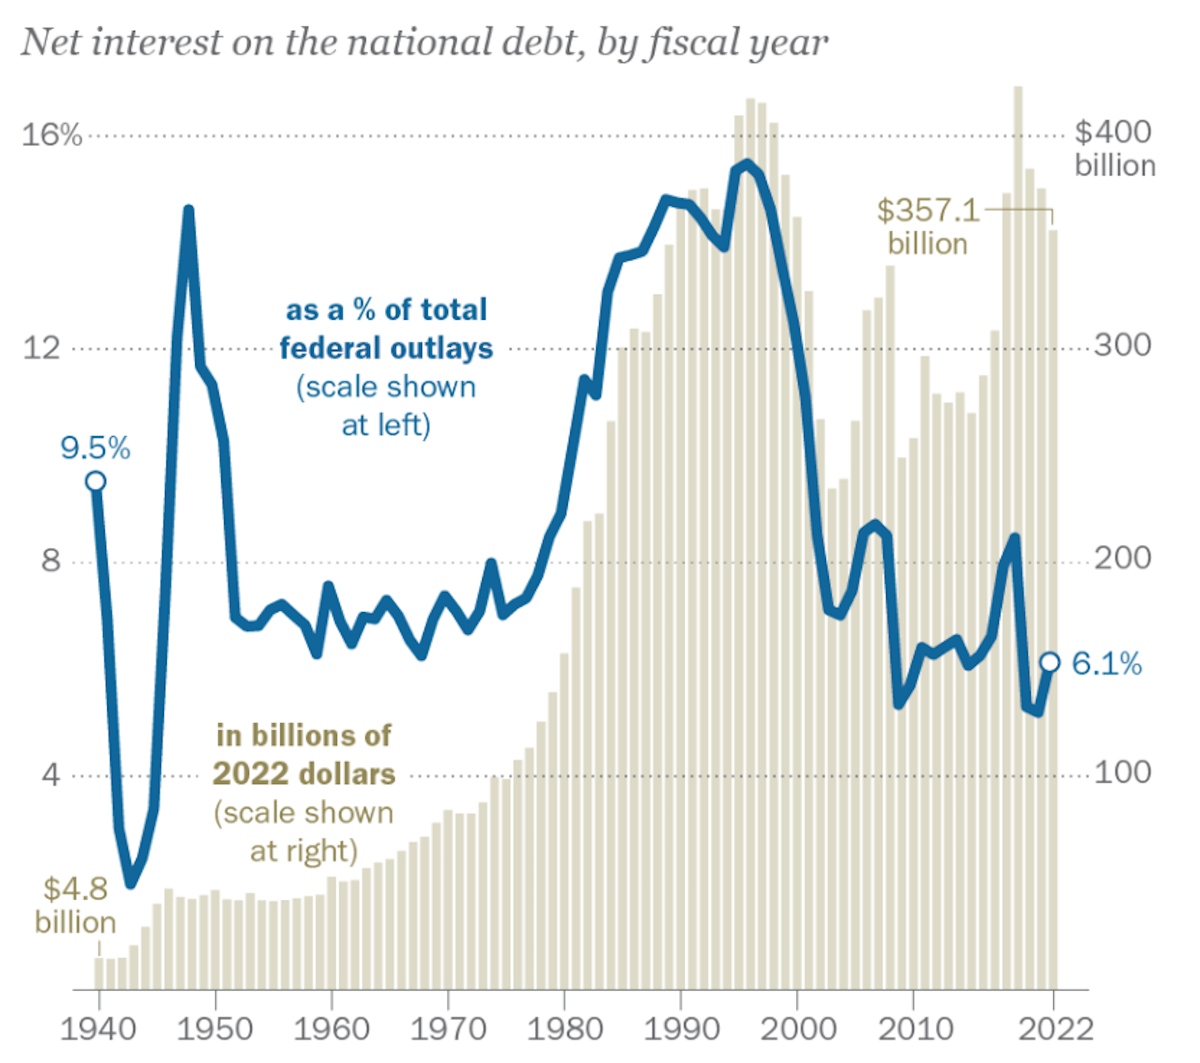
As of 2022, about 33% of US tax revenue went to paying the interest on the government’s debt. That may seem high, but again it's actually been far higher in the past. Again, the current level benefits from the low rates of the last decade.
So the current level of US government debt is more manageable than it may seem, but it's also on an unsustainable path, because rates aren’t as low as they used to be. That brings us to 4 important questions:
- When would US debt become unsustainable?
- What can policy makers do?
- When will policymakers act?
- How will government action affect investors?
When Would Debt Become Unsustainable?
If an economy is growing, tax revenue should also be increasing. As long as tax revenue is growing faster than interest payments, the situation should be sustainable.
Interest payments also need to be stable as a percentage of the budget. If they consume too much of the budget, the spending may reduce elsewhere which acts as a drag on GDP growth, resulting in slower tax revenue growth. What if spending elsewhere doesn’t decrease? You guessed it, they take on more debt to afford it, which can become a vicious cycle of spending more than you make.
The projection below shows how interest payments are projected to compare to other budget items in 2023 and 10 years from now. It also illustrates that Medicare and Social Security are parallel challenges.

The other factor is the refinancing of debt. When bonds mature, new bonds paying a new interest rate are sold to replace them. If debt is refinanced at higher rates, interest payments rise. So expectations about inflation and rates also contribute to the level of uncertainty over how sustainable this is in the future.
Refinancing debt also assumes there will be buyers for that debt. This is where the US is in a unique position. The US dollar is the world’s trading currency and the world’s reserve currency. This has made it the currency of choice for private sector savings around the world.
Earlier in the year, we mentioned that there was a lot of talk about ‘de-dollarization’. While a lot of parties would like to see the USD lose its status, the alternatives all have their drawbacks.
Until there is an alternative, institutions will have to keep buying USD bonds - but those bonds may well pay higher interest rates than the ones they replace, which appeals to the investor (higher return), but not as much to the issuer (the government).
A recent paper from Penn Wharton estimates that US debt would become unsustainable in 20 years, based on current policies. Other forecasts see the problem as more pressing, and see Social Security and Medicare contributing to a crisis within 10 years .
What Can Policymakers Do?
There are several ways to bring government debt under control:
- Spending cuts
- AKA austerity is the obvious one, but it's also unpopular with voters.
- Reducing government spending can also impact the economy in the short term resulting in lower tax revenues.
- Raising taxes
- This is yet another double edged sword.
- Higher taxes result in higher revenue, but can also lead to lower growth in the long term if investment falls.
- Redirecting spending
- This is intended to improve productivity, which sounds sensible in theory but difficult in practice.
- Monetizing the debt
- This is done via money printing and is a common way out.
- Often referred to as an “invisible tax”, printing money (debt monetization) , is a short term fix (cash injection) with longer term consequences (as we’re seeing with the past 18 months of inflation and increased leverage).
In reality, governments usually try a combination of the above. There’s a fifth solution, debt restructuring.
This is typically implemented when the problem is ignored for too long and the inevitable debt crisis occurs. This usually means investors in those government bonds lose a portion of their investment, or the debt is repaid later. So you can see why it’s an unappealing option.
When Will Policymakers Act?
Politicians talking about spending cuts is one thing, but actually cutting government expenditure is more difficult. Politicians are typically focused on the next election cycles and voters tend to vote for popular programs that involve government spending, without much consideration of the longer term consequences.
Usually, policymakers take action when they are forced to do so by the market - as we’ve seen in the UK over the last year. For the US this is likely to take the form of much higher yields as investors demand more interest to compensate them for the growing risk. This could push interest payments to a level that forces action.
How Will Government Action Affect Investors?
As mentioned, investors have few alternatives, so the repricing of US debt, particularly long dated bonds, is likely to be a gradual process. If or when the government is forced to act, this could affect the companies that earn significant revenue from the government.
Make sure you know how dependent companies you invest in are on government spending. Below is an image of the breakdown of 2022 US government spending by department. As you’d expect, stocks in the defense sector are huge beneficiaries of government spending, and the government has a history of paying its bills in this sector.
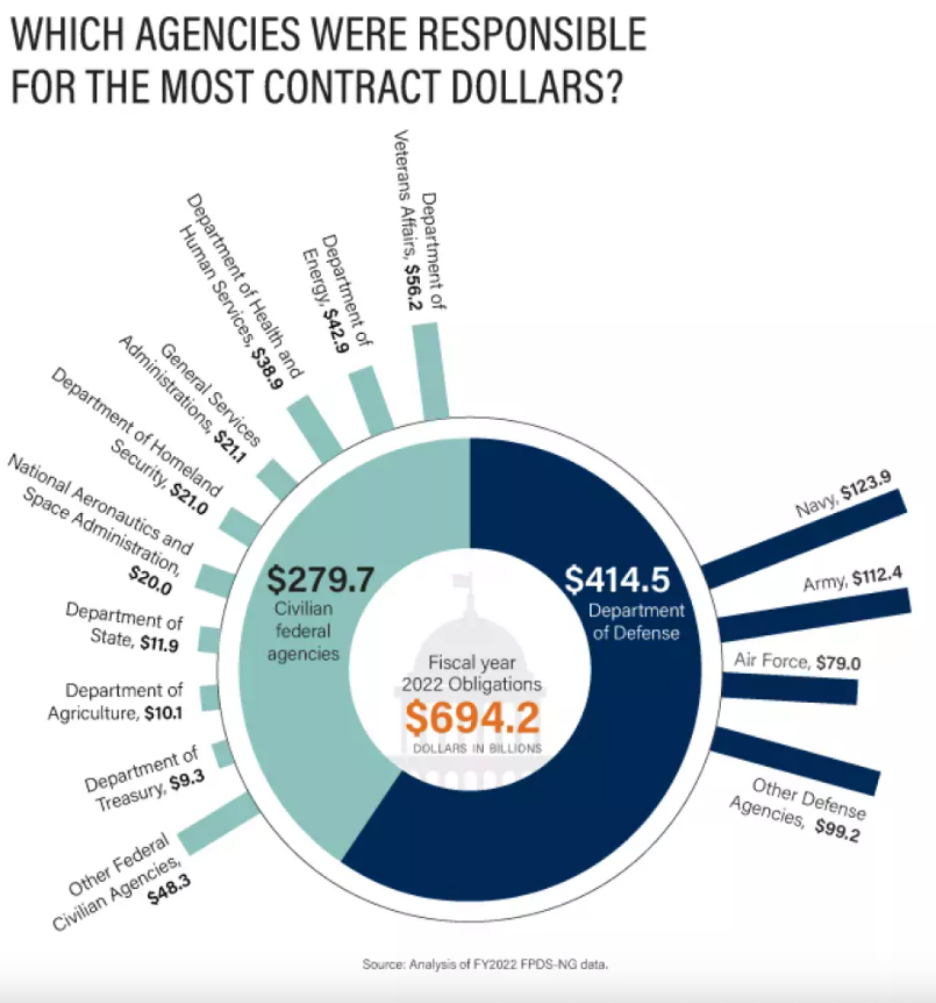
For example, in 2022 Lockheed Martin made 71% of its $67bn in revenue from US government spending alone.
Debt Matters Again
Company debt is also back in the spotlight now that bond yields have reached 16 year highs. Debt hasn’t been much of an issue for companies and their investors since the Fed pursued a ZIRP (zero interest-rate policy) approach to rates.
Companies were able to easily finance debt at levels that barely impacted their earnings. Prior to 2009, debt was something that investors needed to pay attention to, and that’s starting to become the case again.
Take Verizon for an example. Verizon’s net debt-to-equity ratio is currently sitting at 158% and its debt of $157bn currently dwarfs its $4.92bn in cash.
While this isn’t bad in isolation, the more concerning part is how the company’s debt maturity profile changes over time. As the company pays off its lower interest debt, newly issued higher interest debt will take its place and we’ll see Verizon’s interest expense trend upwards. This could be cause for concern if the company’s cash flows no longer adequately service the debt.

💡The Insight: Debt is a Double Edged Sword
According to Buffett, “Leverage” (debt) is one of the 3 L’s to go broke . Debt enhances earnings during the good times, but it can sink a company during the bad times.
When the current cycle of rate hikes began it mostly affected valuations as future earnings need to be discounted at higher rates. But interest rates are now reaching levels where they are affecting companies ability to raise capital or refinance debt. Some analysts expect corporate default rates to rise sharply in the near future.
You can check a company’s debt levels and affordability by referring to the ‘Financial Health’ section of the Simply Wall Street company report for each company.
This is where you can compare a company’s short and long term liabilities to its assets.
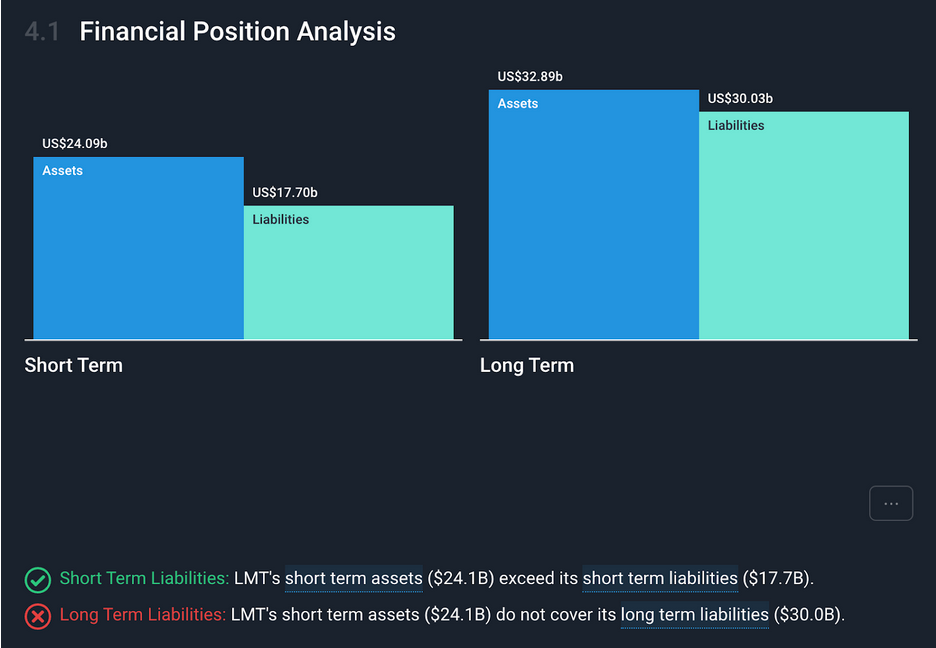
If liabilities are high relative to assets you’ll want to download the annual report (the website is listed under Section 8: Company Information ), and check the interest rate and maturity of the debt. This will give you an idea of when that debt will need to be refinanced and how it could affect expenses.
Something else to keep in mind is the effect a company’s debt has on economic performance.
If a company uses debt, its ROE (return on equity) will be higher than similar metrics like ROA (return on assets) and ROCE (return on capital employed). This could change if interest expenses increase.
The image below shows how debt has enhanced the ROE for Marathon Petroleum which has relatively high debt compared to its peers.

So to bring that all together:
- Find out where a company's revenues are coming from.
- Is it reliant on government spending directly, or indirectly?
- Find out how leveraged a company is, if it can afford this debt, and if it could afford higher interest rates.
- The financial health analysis on Simply Wall St gives an overview.
- The financial health analysis on Simply Wall St gives an overview.
What Else is Happening?
First a recap of the key data releases we mentioned last week…
- 🇺🇲 US Producer Price Inflation was slightly higher than expected in September.
- Prices rose 0.5% compared to the 0.3% that was expected, but lower than the 0.7% in August.
- This ties in with the recent trend where inflation is stabilizing rather than falling.
- 🏛️ The minutes from the last Fed meeting showed that the committee sees ‘ restrictive’ policy staying in place until inflation eases .
And then, a few other items that we thought were worth noting…
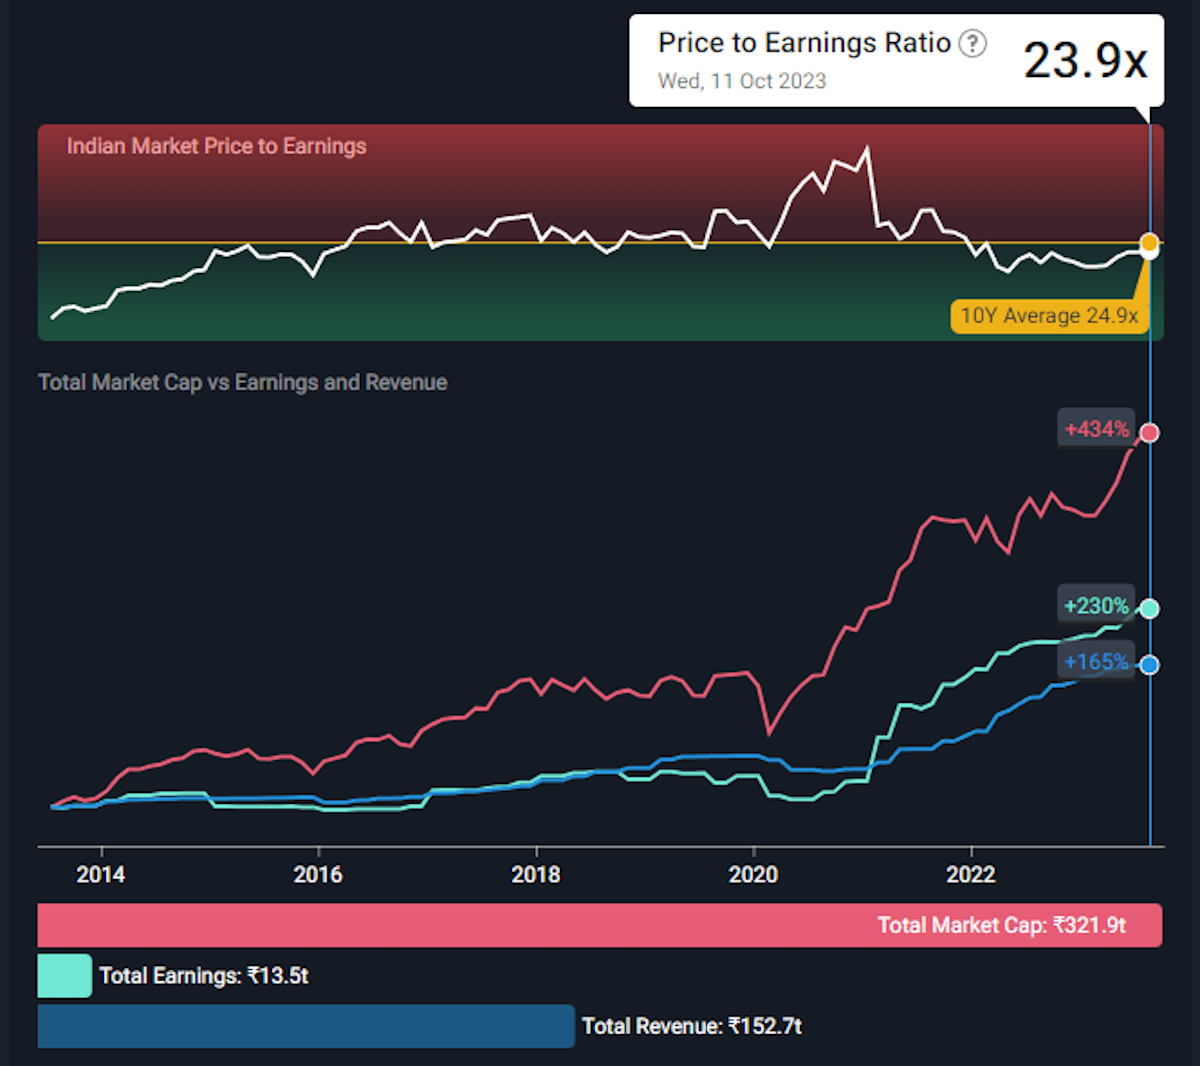
- 🇮🇳 India seems to be particularly well positioned at the moment.
- Global money managers are also paying attention , and JP Morgan recently added the country to its emerging markets bond index .
- India’s Nifty 50 Index is now at a record high along with corporate revenues and earnings. While the average price earnings ratio is still close to its 10 year average, valuations need to be assessed on a stock by stock basis.
- 🍎 Apple is the world’s most profitable company and generates the fifth most revenue.
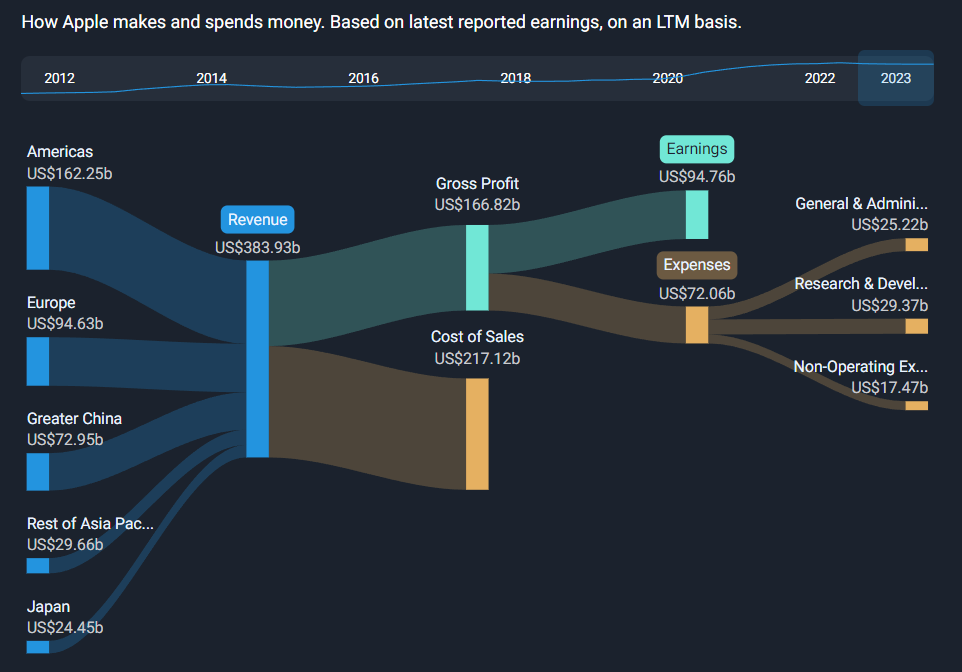
- Quartr published a great infographic which shows how some of that revenue is spent - specifically for the new iPhone. For reference, about half of Apple’s revenue comes from iPhone sales .

- The Sankey chart from Apple Past Performance section shows how those suppliers fit into the bigger picture for Apple, coming under the “Cost of Sales” expense.
- Some investor’s narratives on Apple think that more parts are coming in house , which could reduce the cost of sales expense for them longer term, and increase margins.

Key Events During The Next Week
This week starts off with the UK’s unemployment rate on Tuesday. Also in the UK, the inflation rate is due on Wednesday and retail sales on Friday.
US retail sales will be published on Tuesday and Building Permits are due on Wednesday.
China’s closely followed GDP growth rate will be published on Wednesday. And then in Japan, trade data is due on Thursday followed by inflation data on Friday.
Third quarter earnings season is now in full swing, with the first of the large tech, industrial and consumer companies joining the big banks:
- Johnson & Johnson
- Bank of America
- Goldman Sachs
- Lockheed Martin
- United Airlines
- Procter & Gamble
- ASML
- Tesla
- Netflix
- Abbott Laboratories
- Morgan Stanley
- IBM
- Lam Research
- TSMC
- American Express
Have feedback on this article? Concerned about the content? Get in touch with us directly. Alternatively, email editorial-team@simplywallst.com
Simply Wall St analyst Richard Bowman and Simply Wall St have no position in any of the companies mentioned. This article is general in nature. We provide commentary based on historical data and analyst forecasts only using an unbiased methodology and our articles are not intended to be financial advice. It does not constitute a recommendation to buy or sell any stock and does not take account of your objectives, or your financial situation. We aim to bring you long-term focused analysis driven by fundamental data. Note that our analysis may not factor in the latest price-sensitive company announcements or qualitative material.

Richard Bowman
Richard is an analyst, writer and investor based in Cape Town, South Africa. He has written for several online investment publications and continues to do so. Richard is fascinated by economics, financial markets and behavioral finance. He is also passionate about tools and content that make investing accessible to everyone.